
Los Angeles Hillside Road Demand Analysis
Data-Driven Graph-Based Analysis of Commonly Used Roads in a Large-Scale Transportation Network
- Results from this project have been adapted into the interactive web application: Hillside Street Prioritization
About
This is a subproject under a larger project, the Los Angeles Hillside Streets Prioritization for Capital Improvements, from the Sensing and Robotics for Infrastructure (SRI) Lab at UCLA (Department of Civil and Environmental Engineering). The subproject was developed by Junwon Choi and supervised by Sven Malama, MASc.
This project is currently being updated to account for larger graph representations with igraph package integration, batch processing, and automation. Click here to see the updated code.
Background & Objective
The LA transportation network is a large-scale system that serves a diverse population with varying demographic characteristics. This study aims to address the equity and efficiency of road usage in the Los Angeles (LA) transportation network. The results from this study allow us to allocate importance values of each road segment based on the demographic characteristics of the population that uses them. This feature can be adjusted on the web application to prioritize road segments for capital improvements.
As part of an attempt to efficiently estimate traffic levels based on demographic levels, this subproject provides an alternative method of estimating road demand in the hillside street segments of the LA transportation system using a graph representation of the Los Angeles transportation network and the LEHD Origin-Destination Employment Statistics (LODES) dataset from the U.S. Census Bureau.
This project mainly uses data from the following sources:
- StreetsLA GeoHub Street Inventory (StreetsLA, City of Los Angeles)
- Longitudinal Employer-Household Dynamics Origin-Destination Employment Statistics (LODES) (United States Census Bureau)
Methodology & Key Concepts
- Graph Representation of the LA Transportation Network
- The LA transportation network is represented as a graph where nodes represent intersections and edges represent road segments.
- The graph is constructed using the StreetsLA GeoHub Street Inventory dataset.
- Estimation of Road Demand
- Road demand is estimated based on the demographic characteristics of the population that uses each road segment.
- The demographic characteristics are obtained from the LODES dataset.
- The LODES dataset provides the number of jobs in each census block group and the number of jobs that commute to each census block group.
- Each block is overlaid with the node points of the graph representation of the LA transportation network, allowing us to estimate the number of jobs that commute through each road segment.
- Demand Estimation Algorithm
- The demand estimation algorithm calculates the number of jobs that commute through each road segment based on the demographic characteristics of the population.
- This alogrithm is mainly based on applying the Dijkstra’s single-source shortest path algorithm to the graph representation of the LA transportation network.
- Python scripts are optimized to handle large-scale data processing.
- Current graph network has over 180,000 nodes and 425,000 edges.
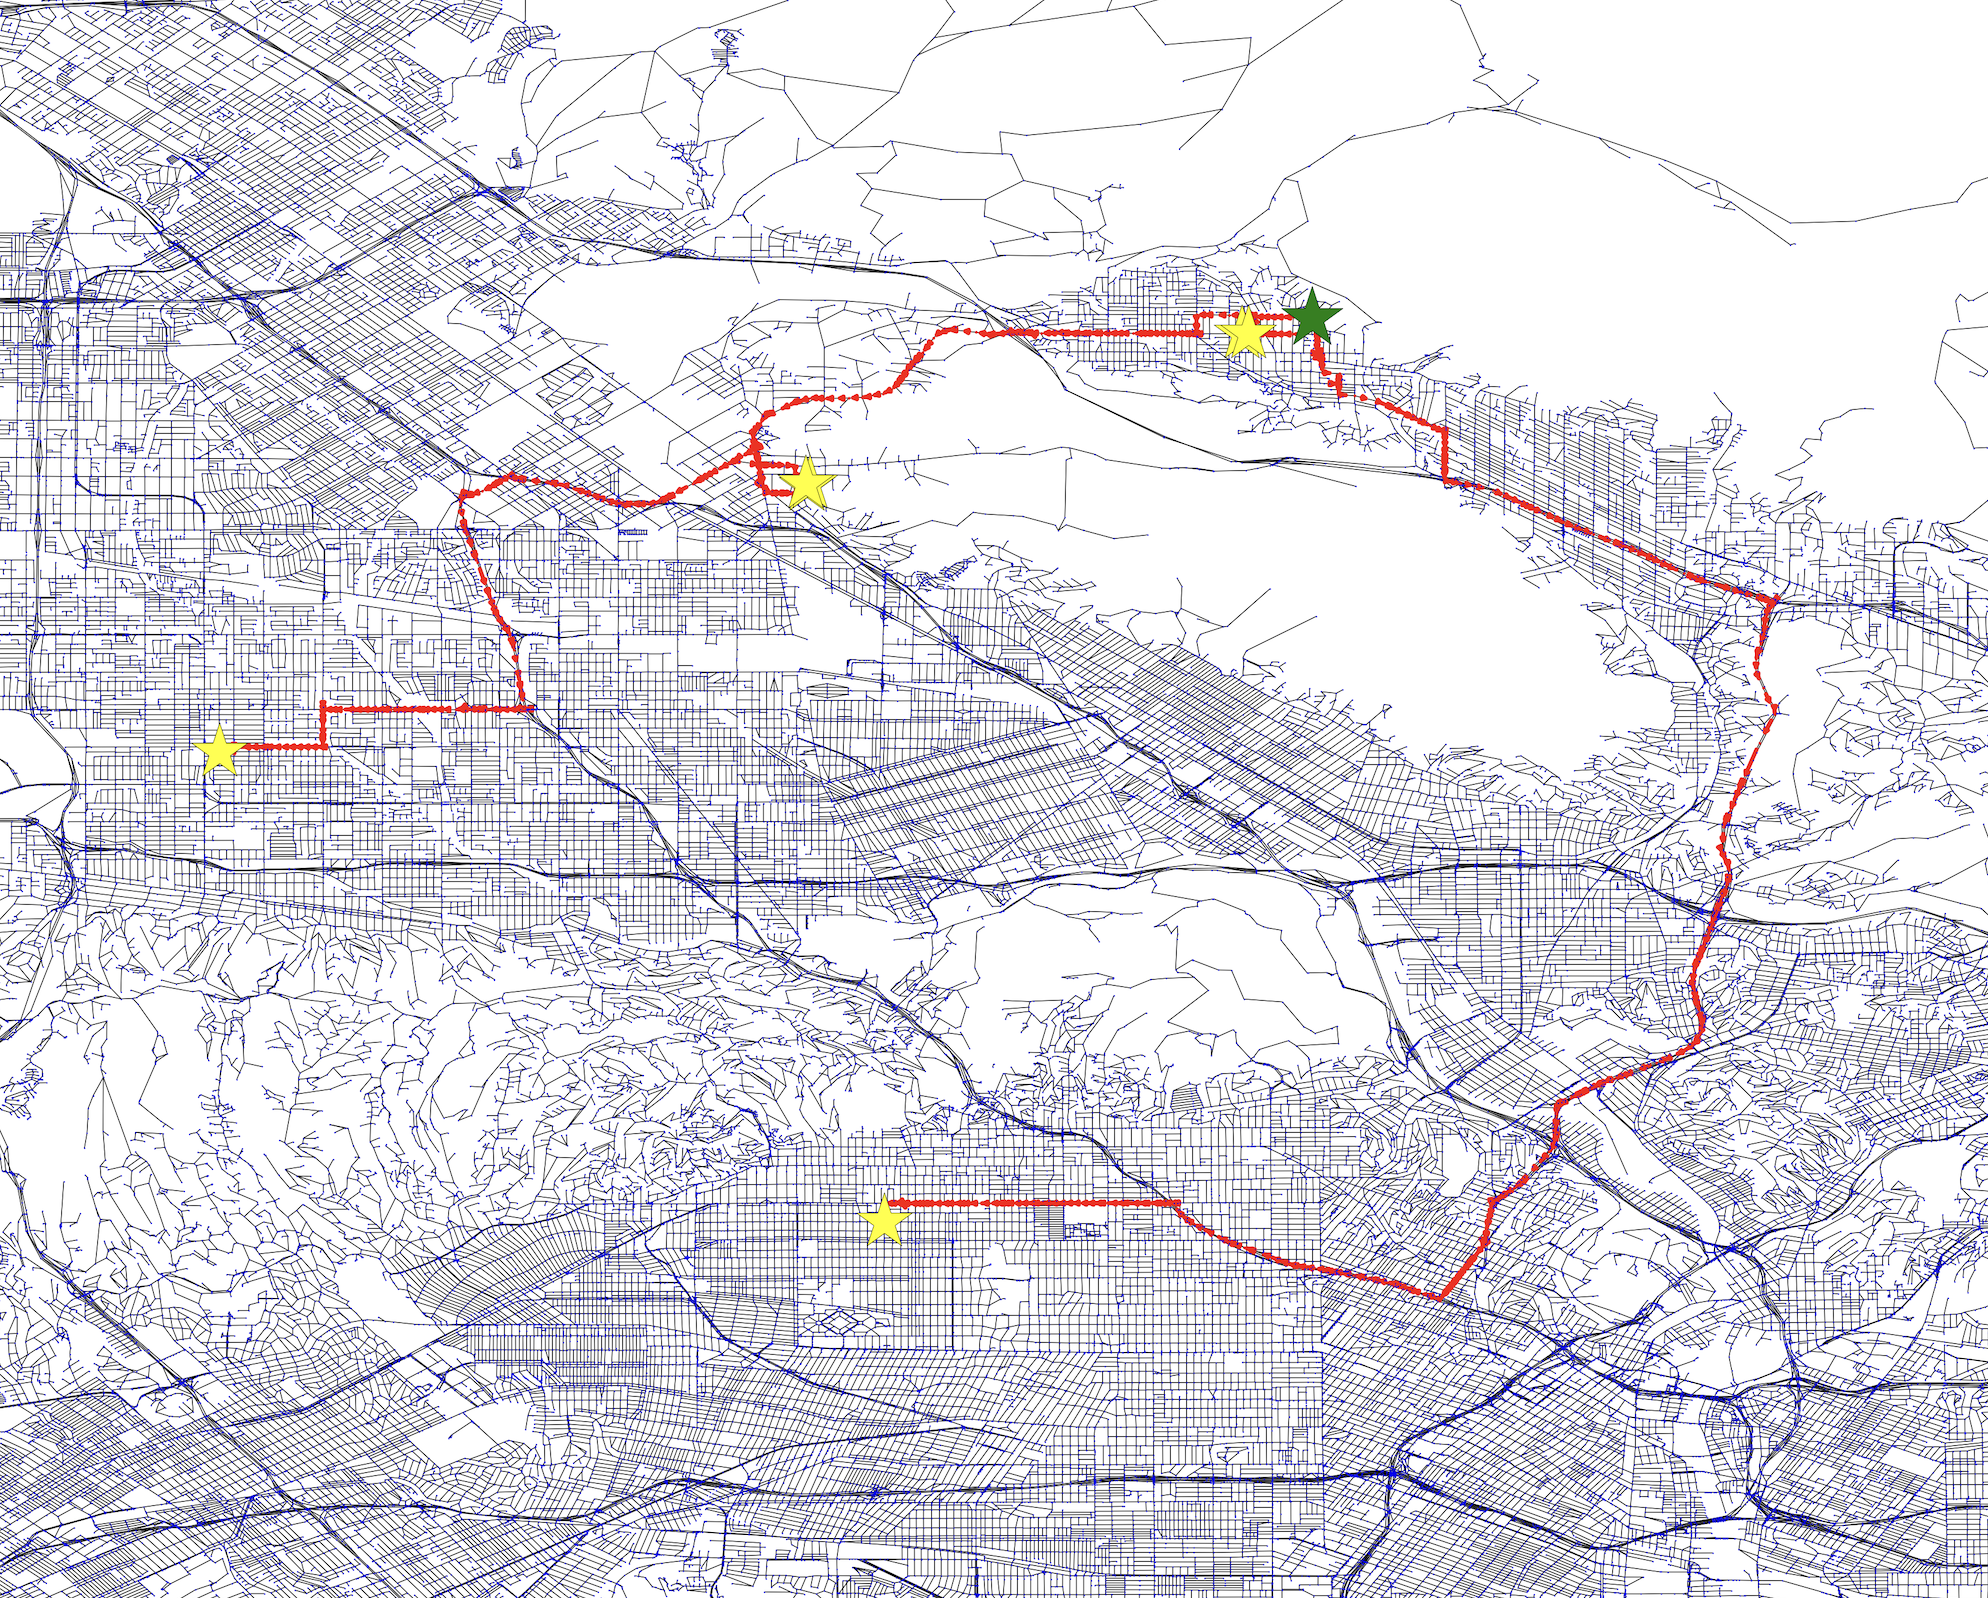
Single Node Sample Result Visualization (Expanded Graph)
The following image shows a sample result of road usage estimation for a source node in the expanded graph representation of the LA transportation network (igraph visualization). The green and yellow stars represent the source node and the destination nodes, respectively.
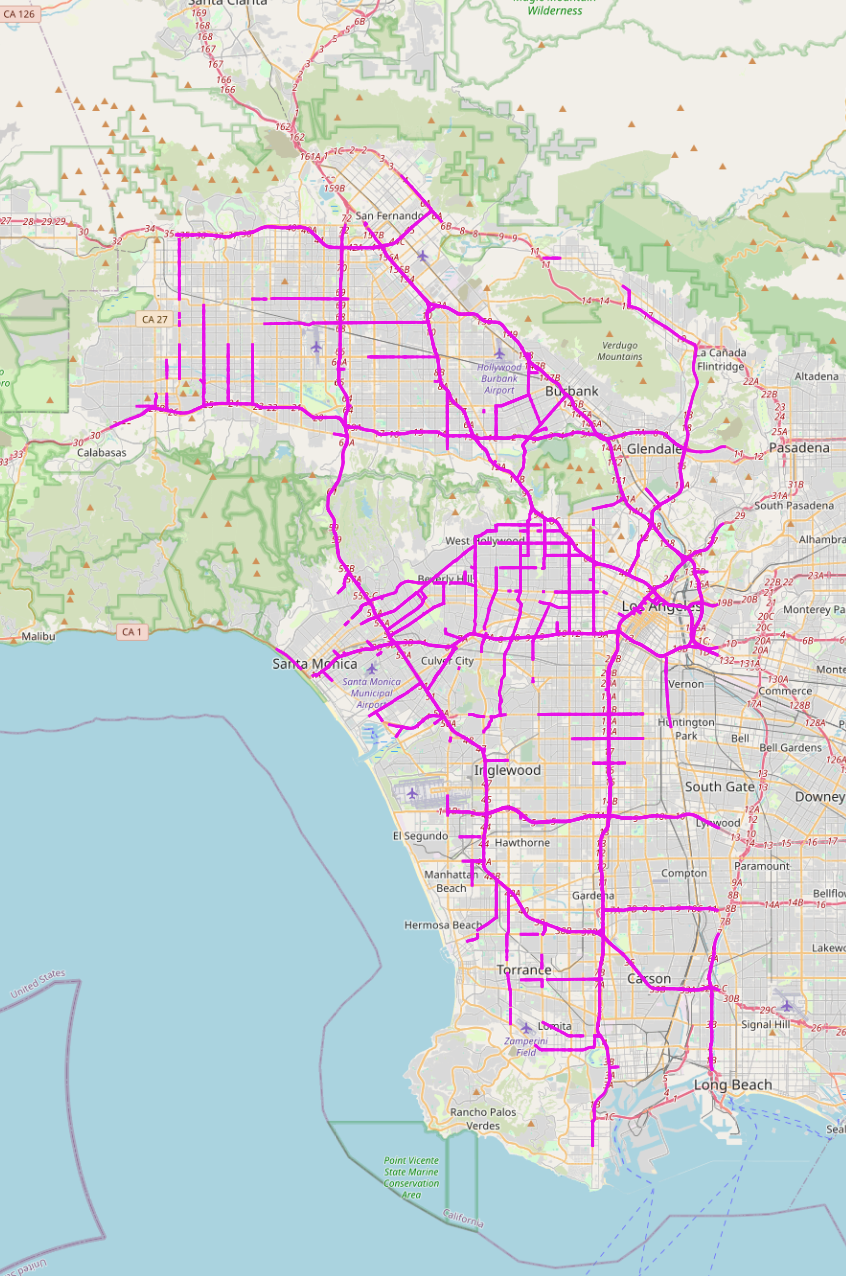
Top 10,000 Road Segments by Demand
The following image shows the top 10,000 road segments by demand in the LA transportation network based on this study (QGIS visualization). The results display major highways in the area, such as the I-405 and Route 27 that connect North and South LA.
Relevant Files
- Code for this project is available on GitHub.
The following slides provide a brief overview of the subproject.
Note: Slides will be updated accordingly as the project progresses.